
Big data often contains data sets with thousands of variables, which increases the time complexity of variability reduction methods such as regression.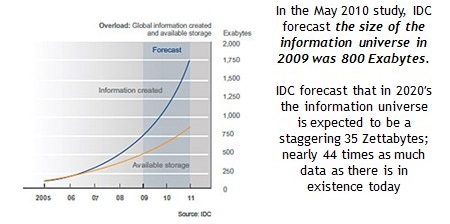
Regression – basics:
Firstly, let us try to understand the uses of regression. Let us consider simple linear regression with two independent variables (say x1 and x2) and one dependent variable (say y). Let us assume that we have 20 observations. Instead of using linear regression, one can estimate the value of y using past values of y. One way is to use Fourier series expansion and finding out derivatives of order 1, 2, 3, … However, this is not efficient because the variance of the estimate is higher than that of the estimate in linear regression. Moreover, changes in x1 and x2 occur before changes in y and there is a cause-effect relationship between them (leading indicators). Hence, it is better to use linear regression to predict y.
The hypothesis can be written as: ![]()
The objective is to minimize sum of squares of errors in the hypothesis estimates. This can be written as
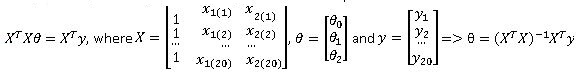
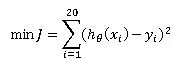 Differentiating with respect to θ0, θ1 and θ2, we get the normal equation which can be written in matrix notation as:
Linear regression is not stable under all cases. There is a special case called multicollinearity in which all the variables will be statistically significant, but the solution changes drastically with changes in data points. To avoid this, we need to form a contingency table, which shows the relationship between x1 and x2. A 2×2 contingency table looks like:
In case of multicollinearity, the sum of elements near diagonals (either main or sub) will be much higher than the sum of elements in the other cells. It is essential to perform this check before going for linear regression in order to ensure stability. There are standard methods to remove multicollinearity, but they are beyond the scope of this article.
What is different in big data?
Big data contains thousands of variables, which leads to a mxm contingency table, where m is very large. The biggest problem in this case is that not all thousand variables can be measured simultaneously. The proportion of variables measured decreases with increase in number of variables. In case of big data, the proportion of populated cells in contingency table is close to 0. Also, number of observations is very large, thus increasing the time complexity of inversion of XTX (mxm matrix).
A statistician’s view:
The popular feeling among analytics professionals is that big data cannot be handled. However, this is not true. It is true that the space complexity of big data cannot be reduced, but the time complexity can be reduced using algorithms and parallel computing [i.e. operations such as inverting (XTX)mxm]. Numerical computations methods have improved over time and can be used to cope with the increasing volume of data. However, the problem of sparseness of contingency table still remains due to unavailability of simultaneous measurement tools.
In short, the problem is not with the volume of the data; it is with the unavailability of right kind of data.


